
Maps are an effective tool helping readers to quickly grasp complex information while putting it into a geographic context. With Eurostat's IMAGE tool you can prepare your own European statistical maps in several predefined map layouts. The map generator offers a wide variety of options. You can use both national and regional data, upload the data or load it directly from Eurostat's database. Additionally, the tool allows you to focus on your own country, or opt for a world map. To get started you can have a look at the help section, with video demonstration and training exercises. The IMAGE tool is available in all 24 EU languages.
New learning material
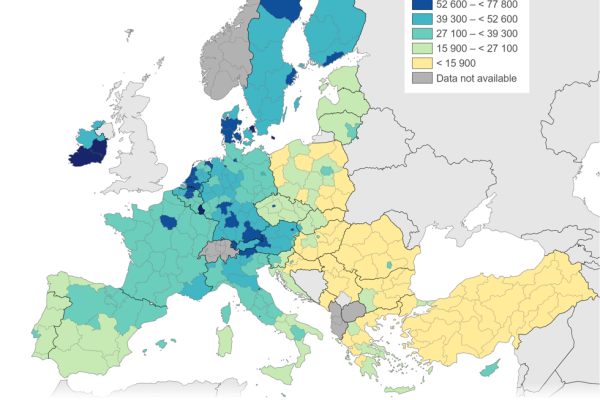
Have you ever wondered how our statistical maps are prepared? Would you like to pare your own? Eurostat's Interactive Map Generator (IMAGE) is a web-based tool that allows you to quickly make professional statistical maps, adding the data or loading it directly from Eurostat's database.
- Publication date
- 12 December 2024
- Author
- Directorate-General for Communication
- Type of content
- News
Related links

Happy teachers’ day!
Are you ready to step up and act on climate change? Or do you know someone who might be interested?
From 1 October to 31 October, a call for new European Climate Pact Ambassadors is open! Applications are assessed on a rolling basis, so early applications (in any EU language) are welcome.
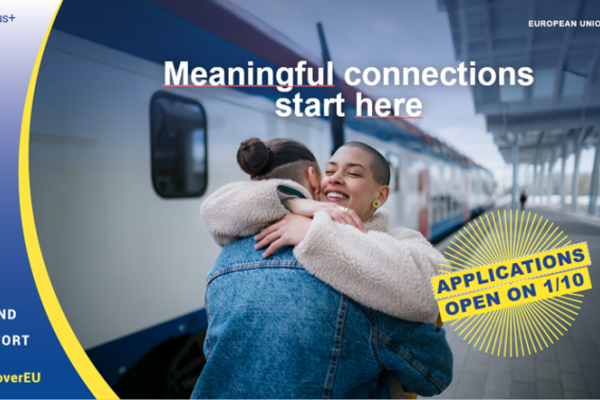
Young people turning 18 in 2026 will soon have another opportunity to explore Europe through DiscoverEU, part of the Erasmus+ programme.
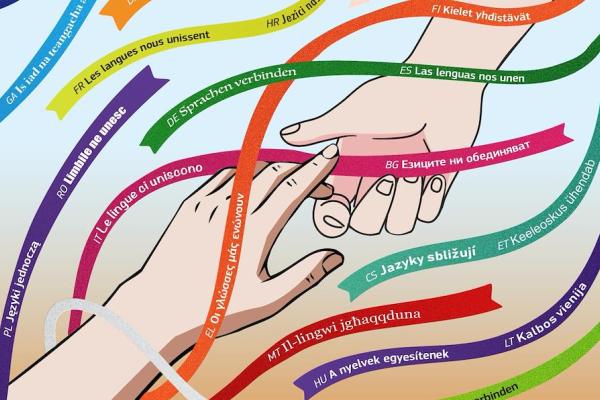
How many languages can you say hello in? On 26 September, Europe celebrates the European Day of Languages – a chance to discover the fun of languages and celebrate the many ways they bring us together.

On the occasion of Mental Health day on October 10, you can download and print out ready-to-go posters via our dedicated webpage to help young people stay in control of their digital habits.
In the framework of the Better Internet for Kids (BIK+) strategy, the European Commission invites students, parents, teachers and educators across Europe to take part in a survey.